Data-driven software and consulting.

Our Mission

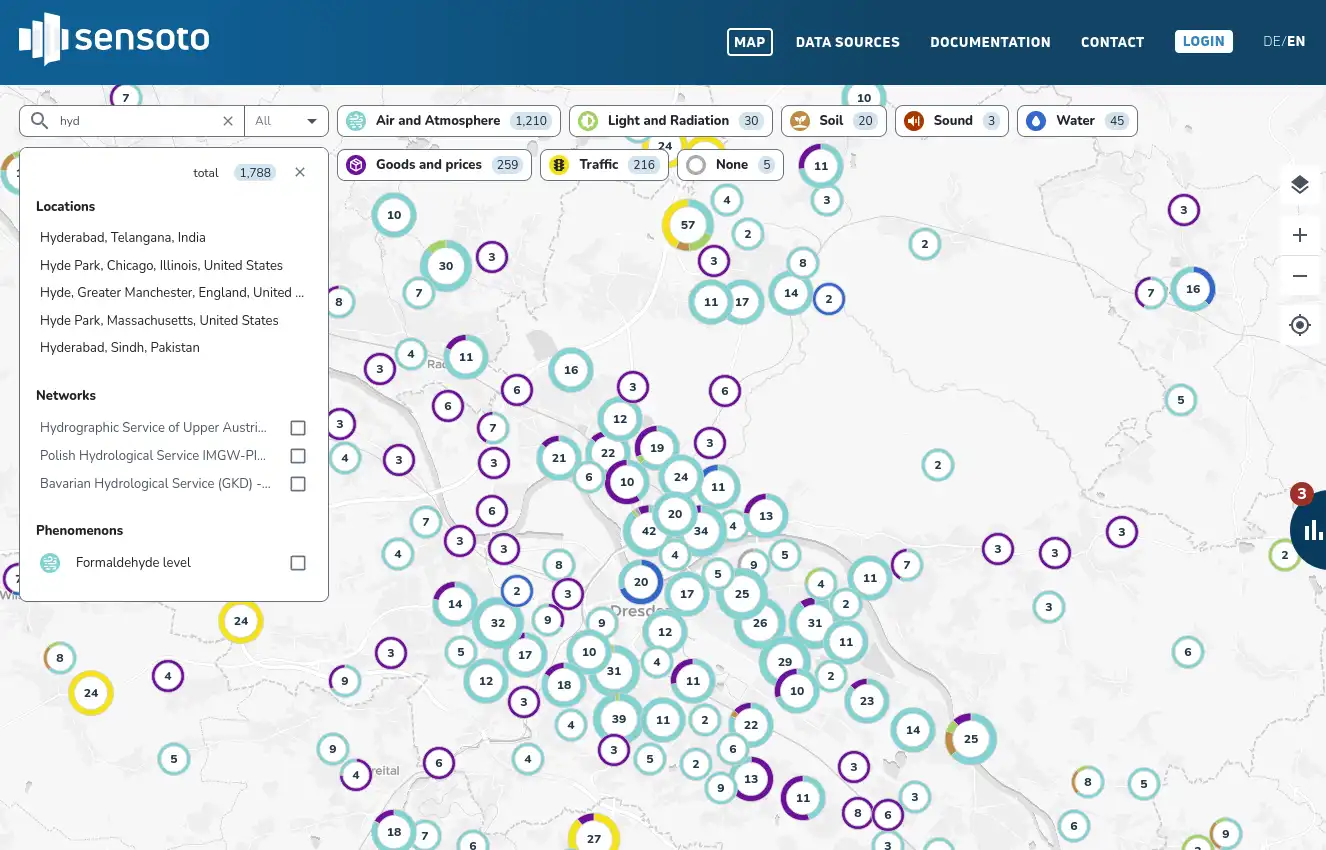
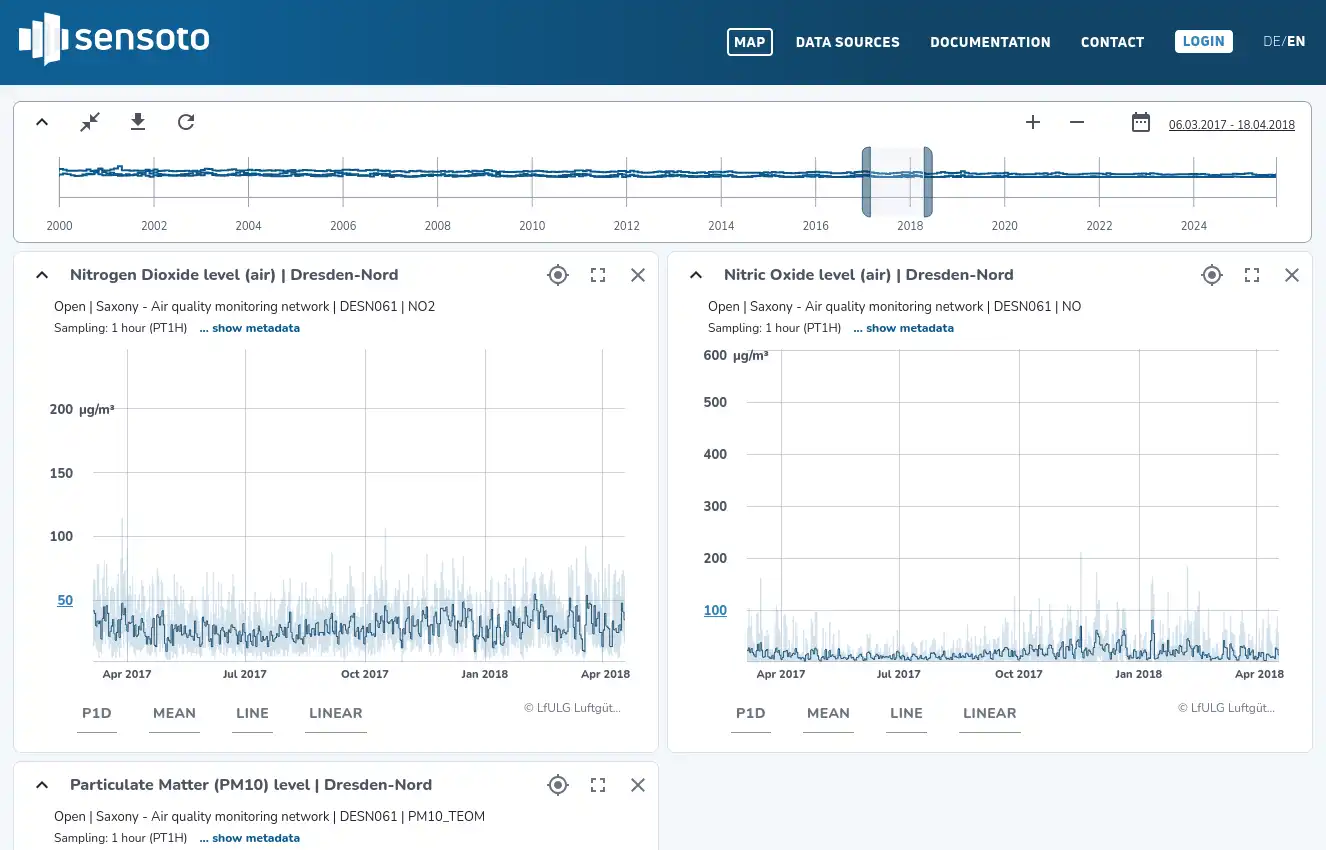
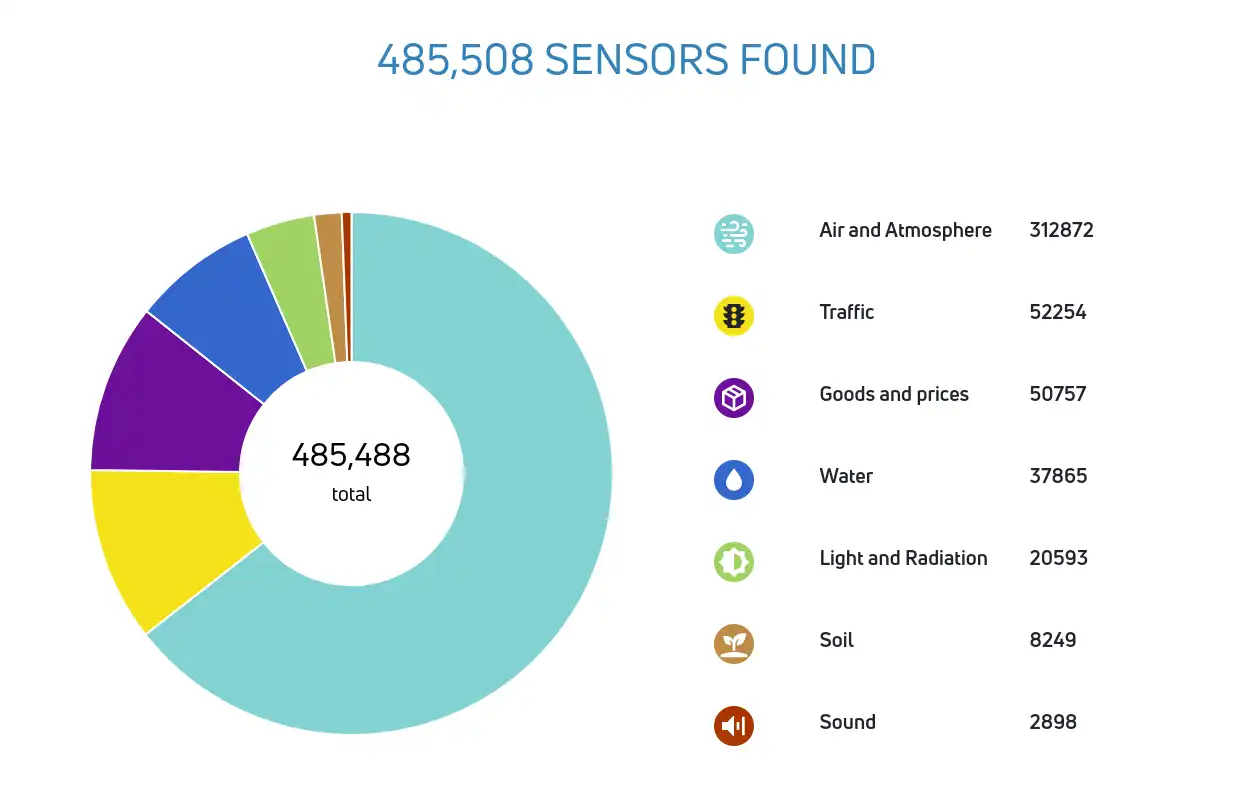
Under the guiding principle of Environmental Data at your Fingertips, PIKOBYTES develops customized solutions for the collection, management and analysis of environmental, infrastructure and geodata. Together with our partners and customers, we work to improve the utilization of environmental and geodata. To this end, we develop powerful databases, intuitive search solutions, interactive visualizations and new concepts for high-density, self-sufficient measurement networks.

Whether for the public sector or private companies - we ensure that data ends up where it is needed. Fast, reliable and attractively visualized.

Fields of activity

PIKOBYTES specializes in the handling of geo, environmental and infrastructure data. We develop IT systems for data assimilation, data management, data visualization and data exploration. In addition, we support our customers with powerful cloud services for integrating and analyzing of environmental data and help them to make better data-driven decisions.

WebGIS, Data Visualization & Interactive Maps

WebGIS, Data Visualization & Interactive Maps

As an independent service provider, we master and support a wide range of commercial GIS products and OpenSource GIS. With our extensive experience, we support our customers in the selection of suitable basic technologies and implement modern WebGIS solutions and applications for data visualization and data research.

GIS & Spatial Ana­lytics

GIS & Spatial Ana­lytics

Our employees have extensive experience in the analysis of geodata and environmental data. We use a wide range of tools to implement projects - from powerful databases to tools from the field of machine learning (ML) and artificial intelligence (AI). Thanks to our broad domain knowledge in the natural sciences and engineering, we can quickly familiarize ourselves with new issues.

Spatial and Geo­spatial Data

Spatial and Geo­spatial Data

The number of available data sets and information portals is constantly increasing thanks to new technical possibilities, powerful satellite constellations, comprehensive measurement networks and innovative development projects. We help you to research and evaluate suitable data sets for your questions and to integrate them into your IT systems.

Sensor Data, Networks, IoT & Smart cities

Sensor Data, Networks, IoT & Smart cities

We have been observing rapid growth in monitoring networks for infrastructure and environmental monitoring for several years. Measurement networks in the fields of air monitoring, traffic, energy, meteorology and hydrology are becoming newly available or are being continuously expanded.

We implement IT systems for our customers using modern, high-performance technologies. With more than 15 years of practical and scientific experience, we are familiar with many technical issues in the natural and engineering sciences and apply this knowledge to the planning of IT systems. We regularly participate in research and development projects and bring technical innovations quickly and reliably into application. We are very familiar with the relevant standards and norms of IETF, OGC, INSPIRE and ISO and apply them where they fit best in the IT solutions of our customers.

Become part of the team

As an IT company, we are specialize in the development of powerful software, cloud services and interactive web applications. We are always happy to welcome new team players who bring a breath of fresh air to PIKOBYTES, are enthusiastic about what they do and want to make life easier for us and our customers. We value flat hierarchies, clear communication and personal responsibility.

Pikobytes SENSOR·HUB

SENSOR-HUB is an IT solution for managing measurement networks and time series data. It offers sufficient scope to connect diverse data streams or entire data archives to the system and to fully utilize sensor data from infrastructure and environmental monitoring for analysis tasks. Thanks to the use of state-of-the-art technologies, there are virtually no limits to data processing: The SENSOR-HUB platform can easily cope with several hundred thousand sensors and billions of measured values.
  • Interactive diagrams allow data to be displayed in full temporal depth
  • Functions for temporal aggregation enable the creation of totals and mean values or conversion to other time zones
  • Various chart types allow the displays to be adapted to the respective application purpose
  • Additional control functions enable interactive adjustment of the diagrams and the display of sensor metadata
Screenshot of the SENSOR•HUB application, which contains several diagrams on the pollutant content in the air.
  • Sensors and measurement locations can be intuitively researched and displayed on an interactive map
  • Adaptive cluster and sensor markers in combination with a simple color and icon system simplify the search and make structures visible
  • Various filter functions allow the map view to be customized according to spatial, thematic and temporal characteristics
Screenshot of the SENSOR•HUB application, showing sensor locations in the city of Dresden.
  • Interactive diagrams allow data to be displayed in full temporal depth
  • Functions for temporal aggregation enable the creation of totals and mean values or conversion to other time zones
  • Various chart types allow the displays to be adapted to the respective application purpose
  • Additional control functions enable interactive adjustment of the diagrams and the display of sensor metadata
Screenshot of the SENSOR•HUB application, which contains several diagrams on the pollutant content in the air.
  • Simply structured REST APIs enable the reading and writing of sensor data and metadata
  • User and rights management supports fine-grained access control down to the level of the individual time series
  • Context data from existing third-party providers, e.g. the German Weather Service or Pegelonline, can be provided at the touch of a button or, if not available, connected via a powerful framework of data adapters
  • IoT devices can be integrated directly via individual binary protocols or alternative IoT gateways
  • Highly optimized time series databases enable the storage of many billions of measured values at consistently high read/write speeds
  • Support for formula-based, derived time series using virtual sensors
  • In-memory indices accelerate interactive research and data filtering
  • All system components of the SENSOR-HUB can be operated redundantly and in parallel on distributed systems
Screenshot of SENSOR•HUB showing a map with sensors and associated diagrams.
+49 (0)351 850 901 00